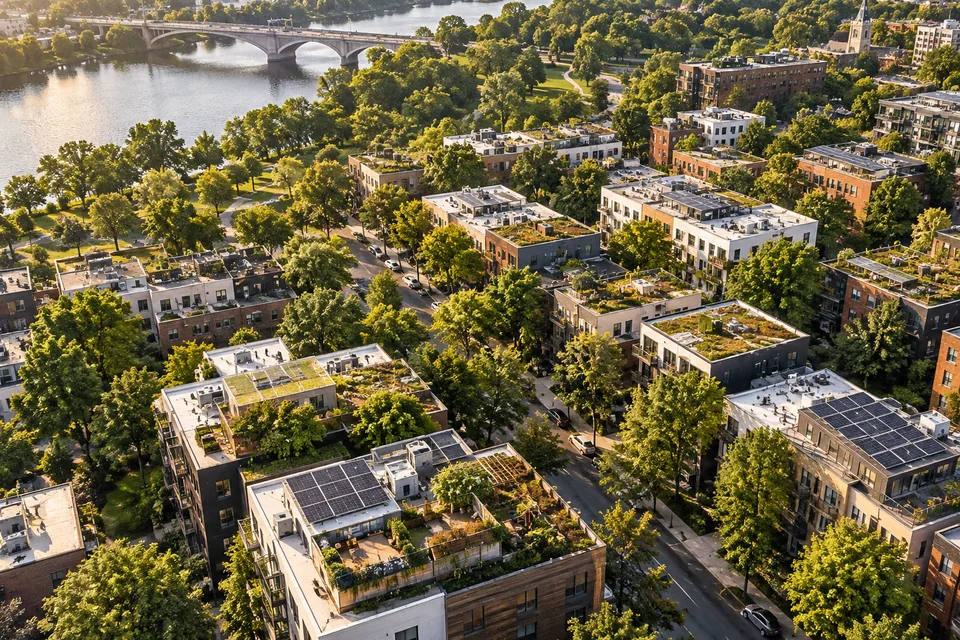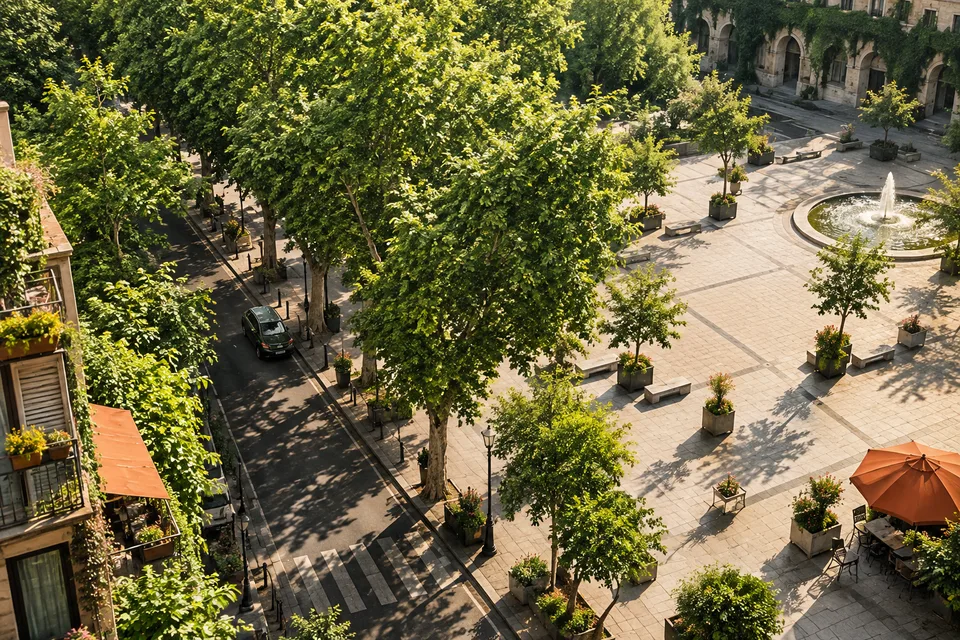
The first map looks encouraging. Green patches spread across the city, filling parks, gardens and planted avenues. A percentage in the corner says how much ground lies beneath tree crowns. It is a useful picture of an urban forest. It does not tell someone waiting for a bus whether there will be shade at four in the afternoon.
The second map would have to move. It would follow the sun across a shelter, a crossing and the pavement between them. It would mark the entrance that people actually use, rather than the planted boundary at the other side of the property. It would distinguish a shaded destination from a shaded journey. A city needs the first map to understand its canopy. It needs something closer to the second to understand how people encounter heat.
This is more than a choice of cartography. What is measured determines which projects appear successful. A large planting on an available parcel can improve a citywide statistic while leaving a busy walking route exposed. A modest structure over a waiting area can change the experience immediately while adding nothing to tree canopy. Neither result should disappear because the dashboard has room for only one number.
A different plan for a familiar problem
Phoenix makes this tension unusually visible. Its May 2026 policy briefing records that the council unanimously adopted Shade Phoenix in November 2024, replacing the 2010 tree-and-shade master plan. The newer plan has 36 actions, covering expansion, preservation, implementation and community capacity, with attention to undershaded communities. Trees and built shade both belong in its stated vision.
The significance is the combination, rather than the action count. A street can need a mature canopy in the long run and a useful place to wait this summer. Keeping an existing crown alive can be as consequential as planting elsewhere. Delivering either may involve transport, streets, parks and property owners, each controlling a different part of a person’s route.
A plan organized only around planting can miss those connections. The tree may be on the wrong side of a fence. A shaded park may be separated from homes by an exposed crossing. A shelter may cover the bench at noon but not the queue later. These are questions for site observation and design; an aerial percentage cannot resolve them.
They also explain why a citywide average is a poor account of distribution. A city could gain canopy overall while a neighborhood loses mature trees, or while new growth occurs mainly where cover was already abundant. The average would remain mathematically correct. The public conclusion drawn from it could still be wrong.
Three temperatures, three questions
An apparent disagreement about tree cooling may begin with people measuring different things. Land-surface temperature describes the surface being observed. Air temperature describes the surrounding air at a specified place and time. Radiant conditions concern the energy exchanged with the sun and surrounding surfaces. A person walking outdoors experiences more than the temperature reported by a distant weather station.
Phoenix’s public shade explanation illustrates air, surface and radiant temperatures separately. That distinction matters when a dramatic cooling number is repeated. A reduction depicted for radiant conditions is not automatically an equivalent reduction in ambient air temperature. Removing the label can turn a useful illustration into an exaggerated promise.
A newly published Scientific Reports paper by Michael Alonzo, Matthew Baker and Ali Amini, released on 13 October 2026, sharpens the measurement issue. Modeling land cover against surface temperatures and mobile air measurements in 11 northeastern US cities, the researchers found different patterns for the two heat measures. They also caution that canopy-only models and coarser canopy data can overstate cooling effectiveness in dense settings. The study is early-access, peer-reviewed research, not a universal planting prescription for every climate.
That last limit is important in reading it alongside Phoenix. A northeastern multi-city analysis cannot simply supply a cooling coefficient for a desert street. It does support a broader analytical warning: a surface-temperature map should not be casually relabeled a map of human comfort or air temperature. The variable, resolution and local conditions belong beside the result.
This does not make satellite data unhelpful. Wide coverage can reveal patterns that a few sensors would miss. The question is what those patterns establish. A hot roof, a shaded pavement and air along a walking route are connected parts of an urban environment, but they are not interchangeable observations of the same thing.
Put a clock on the route
Consider an imaginary route from an apartment to a bus stop. It passes a planted courtyard, an open crossing and a narrow pavement beside a wall. This is a design example, not a reported inspection of a Phoenix neighborhood.
At one hour, the wall shades much of the pavement. Later, its shadow moves away. The courtyard remains green in both aerial images, but access is through a gate that is closed outside certain hours. The bus stop’s tree shades the sign while the waiting passengers stand elsewhere. A single midday photograph could flatter this route without falsifying anything in the photograph.
A more useful assessment would describe the times people use it and the places they must pause. Waiting is especially easy to omit from a route drawn as a line. A crossing delay or a missed bus can keep someone in one exposed location longer than the walking segment before it. The map needs to represent that possibility without pretending every traveler has an identical itinerary.
| View | What it can reveal | What still needs checking |
|---|---|---|
| Canopy from above | The extent and distribution of tree crowns | Access beneath them and shade at relevant hours |
| Surface-temperature image | Surface heat patterns at the observation time | Air conditions and the person’s radiant environment |
| Timed pedestrian route | Exposure and useful shade along a particular journey | Other routes, seasons and users |
| Maintenance record | Whether promised care is actually happening | Whether the resulting canopy serves the intended places |
These views complement one another. A route survey alone would struggle to describe a whole urban forest. A canopy map alone would struggle to explain why an apparently green block still offers an uncomfortable wait. The mistake is to demand that either be the complete answer.
A sapling is not a small mature tree
Planting has an unusually long relationship with its promised result. The initial intervention is visible: a hole, a tree, a support and perhaps a photograph. The useful crown arrives on a different schedule. Its development depends on the species, location, growing conditions and care. A planted-tree total records an activity; it does not measure a mature shade service.
Phoenix’s Community Canopy grant page provides a concrete example of the distinction. It says applications sufficient for a 6,000-tree goal have been received and applications are closed, while planting continues through 2028. It also assigns watering and maintenance to property owners except where a dedicated steward is involved. Applications, completed planting and maintained shade are therefore separate stages, even within one program.
The same grant page limits planting to property boundaries and front yards, excluding the public right of way. That is a practical limit on what its tree total can establish. A grant tree may help a household or eventually contribute nearby shade; it is not, by virtue of its approval, a project for the bus-stop queue or an exposed crossing. Those locations require the responsible landowner and public agencies to act through the appropriate arrangement.
That responsibility deserves attention before the ceremonial planting, not after a hot season exposes a gap. A recipient may need an intelligible care arrangement, reliable access to water and a way to report a problem. Where responsibility changes with a tenancy or property sale, the original agreement may need continuity. A young tree cannot know that a grant has ended or an enthusiastic volunteer has moved away.
Water makes the choice more specific, especially in a dry city. Species suitability, available growing space and an appropriate irrigation design must be considered together. Calling all planting wasteful ignores those distinctions. Calling all planting climate adaptation ignores them too. A credible project explains the local trade-offs and who will sustain its living infrastructure.
The missing entry is often an existing tree
A new planting is easy to count as an addition. Avoiding the loss of an established crown is harder to photograph as progress. Yet a city can spend years replacing a service that disappears in a day. A shade strategy should therefore make preservation visible rather than report only new acquisitions.
This requires records that extend beyond whether a trunk remains on an inventory. Construction can change the space around roots. A maintenance problem can affect the crown. Changes in surrounding development can alter the conditions in which a tree has grown. The relevant expertise belongs in decisions before damage occurs, rather than only in the later removal assessment.
Preservation is not an absolute command to retain every tree under every condition. Safety, condition and conflicts require professional judgment. It is an instruction to count the consequence honestly. If a mature canopy is removed and several small trees are planted, the number of stems may rise while the available shade falls. A dashboard that celebrates the first fact and omits the second describes a transaction, not the service people lost.
There is a similar accounting problem in annual reporting. A city should be able to distinguish gross planting, removals, survival and changing canopy. Combining them too early makes it hard to diagnose what is working. A neighborhood may need better establishment care rather than another planting target, or preservation rather than a larger nursery order.
Shade that can arrive sooner
Built structures have a different timetable. They do not need growing seasons to form a crown, though they need design, permissions, installation and maintenance. Their usefulness also depends on geometry. A handsome overhead panel is a weak investment if the afternoon shadow misses the occupied space.
This makes a combined strategy more credible than a contest between trees and structures. A structure can address a waiting place while a planted landscape establishes. Trees can provide benefits beyond the footprint of a shelter. In some locations, buried services, narrow space or other constraints will influence which approach is practical. The preferred solution follows the site and the service, not a blanket rule that one material is always superior.
The budget should acknowledge both clocks. Immediate shade does not remove the need to care for trees. A long-term canopy target does not justify leaving a known waiting area exposed indefinitely. A five-year capital program and a summer operating problem require connected decisions even when they appear in different departments’ accounts.
What would count as a better map?
A public report could begin with canopy, then locate the routes and waiting places selected for intervention. It could state which hours and seasons matter, distinguish planted from established trees, and show whether maintenance obligations have been met. It could retain uncertainty where a model estimates cooling rather than measuring it on site.
The result would be less visually simple than one expanding green percentage. It would also be harder to game. Adding easy trees elsewhere would not by itself demonstrate progress at the bus stop. Installing a shelter would have to be judged by the space it shades, not just by the existence of a finished asset.
The two maps finally have a common purpose. One records the living cover a city needs to preserve and grow. The other asks whether that cover, together with built shade and the design of streets, helps people use the city. A person should not have to study the aerial image to be told that the route they are standing on has become cooler.
Sources & context
This article draws on the sources linked in the text. Analysis and illustrative scenarios are identified separately from reported findings.
- May 2026 policy briefing
- public shade explanation
- Scientific Reports paper by Michael Alonzo, Matthew Baker and Ali Amini
- Community Canopy grant page