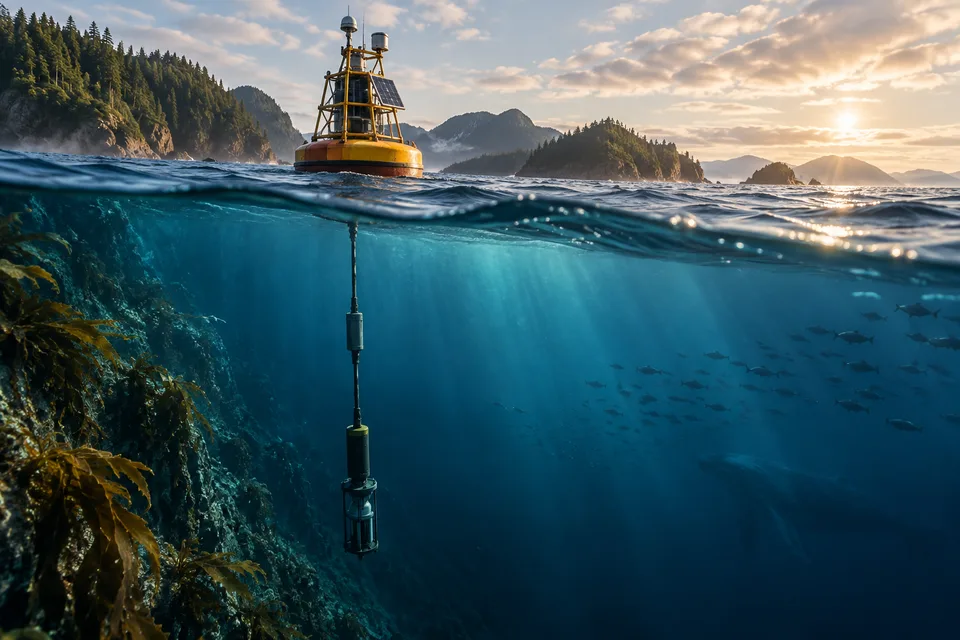
The surface can cool while the ocean gains heat. That sounds contradictory only if the ocean is imagined as a thin blue sheet with one temperature. It is a volume of moving water, and the measurements made at different depths describe different parts of its changing energy store.
A January 2026 study of the preceding year’s ocean conditions puts numbers on that contrast. Its IAP/CAS estimate shows the upper 2,000 metres gaining approximately 23 ± 8 zettajoules in 2025 relative to 2024. One zettajoule is 10²¹ joules; this is a change in thermal energy across a large volume, not a temperature reading at one depth.
The study’s global annual sea-surface estimate was about 0.12°C lower than in 2024, while still ranking third warmest in its record. The authors describe that surface change as consistent with developing La Niña conditions. Surface redistribution and exchanges can alter a year’s surface ranking while the integrated heat store grows. The relevant questions are where the heat is being measured and what quantity is being compared.
This is why a year’s surface ranking cannot carry the whole climate account. A surface map is essential for many purposes, but the heat beneath it has its own geography and history. To understand what the ocean is retaining, the story has to descend.
At the surface: a boundary that moves
Sea-surface temperature describes conditions near the ocean’s upper boundary. The exact measurement depends on the observing method and product. It responds to exchanges with the atmosphere and to ocean processes that mix or transport water. A warm or cool patch is therefore part of a physical system, not a tile that stays attached to one location forever.
Ocean heat content asks a different question: how much thermal energy is contained within a defined volume, usually expressed as a change relative to a reference. It combines temperature information through depth and across an area. The depth range and reference period belong beside the result because they define what has been added up.
The distinction is familiar in a simplified vessel of water. A warm upper layer does not tell you the temperature of everything below it. Conversely, a small temperature change across a large volume can represent substantial energy. This is an analogy for measurement, not a model of the circulation or mixing in an actual ocean basin.
The World Meteorological Organization’s 2025 climate summary, released in 2026, reports the year’s ocean heat content as the highest in a 66-year observational record and labels its chart as the 0–2,000-meter layer. The annual conclusion refers to 2025, not to a completed 2026 ocean record. Keeping the date and depth on the page prevents an updated publication from being mistaken for a different observation period.
Through the upper ocean: the profile matters
An ocean profile records how properties change with depth at a place and time. Repeating such measurements across the ocean allows researchers to investigate patterns that a surface view cannot reveal. The resulting global record is assembled from observations; it is not obtained by putting a single thermometer into an average ocean.
Argo’s account of its role in climate monitoring explains that standard profiles reaching 2,000 meters observe roughly the upper half of the ocean’s volume. It describes how upper layers fluctuate with shorter-term climate events while deeper observations help reveal longer-term change. Continuous coverage is important because short-term variations can otherwise complicate interpretation of the trend.
“Upper half” is easy to misread. Two thousand meters is a substantial depth, yet a large fraction of the ocean lies below it. An upper-ocean heat-content estimate can be extremely informative without being a measurement of the entire water column. The boundary is a statement of scope, not an admission that the result is unusable.
The Argo program’s float description explains the sampling timetable. A standard mission lasts about ten days. The float spends roughly nine drifting near 1,000 metres, descends to around 2,000 metres, then records a profile as it rises. At the surface it establishes its position and transmits data by satellite before the cycle repeats.
The instrument changes depth by changing buoyancy: moving oil into an external bladder increases volume without increasing mass, allowing it to rise. This is a moving autonomous sampler, not a fixed thermometer continuously recording one water column. Repeated profiles from the array have to be quality-controlled and combined across time and space. That distinction helps explain both the record’s reach and the reconstruction work behind a global annual number.
This is a demanding kind of continuity. Instruments need replacement, calibration knowledge must be preserved and changes in observing methods must be understood. The resulting series is scientific infrastructure. It cannot be recreated instantly after a gap merely by publishing a new dashboard.
At 2,000 meters: the dataset has a boundary
NOAA’s Ocean Heat Content Climate Data Record offers time series on three-monthly, annual and five-year scales, with defined depth ranges. Such products make it possible to study changes over time, but selecting a series is also selecting its scope. A value for 0–700 meters is not interchangeable with one for 0–2,000 meters.
A graph’s vertical unit matters too. Heat content may be expressed in energy units, while a temperature anomaly is expressed in degrees. Some presentations convert or normalize quantities to make them easier to interpret. The accompanying method needs to say what was done. A number cannot be moved from one chart to another solely because both discuss a warming ocean.
The baseline changes the zero line rather than rewriting the measurements. A different reference period can change the displayed anomaly without demonstrating that the ocean suddenly gained or lost the difference between two labels. Comparisons should therefore align the reference, area, depth and period before treating two products as disagreeing.
These are not decorative details. A headline about a record often depends on a ranking within a defined series. The rank can be sound while the exact amount differs between analyses because of methods, input observations or coverage. A good account reports agreement and uncertainty at the level the evidence supports.
| The label to retain | The question it answers |
|---|---|
| Area or basin | Which water is included? |
| Depth interval | How much of the water column is represented? |
| Time interval | Is this a month, year or longer average? |
| Reference period | What defines the anomaly’s zero? |
| Unit and method | Is the result temperature, energy or a normalized measure? |
Reading those labels does not diminish the significance of a record. It makes clear what the record means.
Farther down: the observing task is unfinished
Deep Argo extends the observing ambition below conventional profiles. The program’s mission description identifies float designs capable of reaching 4,000 or 6,000 meters and the need for systematic full-depth sampling to improve planetary heat, freshwater and sea-level budgets. It describes an expansion under development; it should not be read as a claim that every part of the deep ocean is already sampled with the same coverage as the upper array.
The purpose is not simply to break a depth record. Deep observations help establish changes in a large volume that can be difficult to infer from what happens above it. They also make it possible to test an account of the whole system against more of that system’s actual behavior.
The technical and logistical demands are part of the value. A float has to operate in a difficult environment, maintain useful measurement quality and return data. An observing program needs to know what happens as instruments age or are replaced. The scientific result depends on these unglamorous details as much as on the dramatic image of a device descending into darkness.
There is a public funding question here. New hardware can attract attention at launch, while maintaining an array and its data systems can look routine. Yet an ongoing climate record depends on routine operation. A program designed only around occasional novelty risks losing the consistent evidence that makes its new instruments useful.
Return upward: heat has consequences beyond a ranking
Ocean warming contributes to sea-level change through thermal expansion and interacts with the wider climate system. The IPCC’s physical-science assessment identifies thermal expansion alongside land-ice loss in global mean sea-level rise. This is a relationship within a broader budget, not a claim that one global heat-content number predicts the water level at every coast.
Local sea level and coastal risk involve other processes and conditions. A global indicator can establish an important direction of change without replacing a local assessment. Translating ocean heat into a flood-design level requires additional evidence. The scale of the original observation should remain attached to the decision it is meant to inform.
Marine heatwaves are related but distinct again. They concern unusually warm conditions relative to a defined local and seasonal expectation over a particular duration. A global annual heat-content record does not establish the intensity or biological outcome of every regional event. Local observations, depths and the affected ecosystems matter.
The Copernicus ocean-heat-content indicator provides another view of the global record, with a series extending from 1993. Its shorter record start does not contradict WMO’s reference to longer observational reconstructions. Products can cover different periods while supporting a consistent account of continued heat gain. The method and series need to be read before counting the years in a headline.
Agreement needs more than counting lines
When several analyses appear on one chart, their agreement is useful to investigate. It is not automatically the same as several completely independent observing networks reaching the result. Analyses may share some measurements while applying different quality controls, corrections or methods for representing unsampled areas. A careful comparison identifies both the shared foundation and the differences.
This matters most when a small annual difference attracts a large conclusion. The relevant uncertainty may concern sampling, instrument history, spatial reconstruction or the comparison period. Reporting a range does not imply that nothing is known. It identifies the precision with which a particular quantity is supported and helps prevent a narrow numerical difference from being interpreted more strongly than the evidence allows.
Long records should also preserve versions and explanations when methods improve. An update can change an earlier estimate without changing what the ocean physically did. The ability to trace that revision is part of a trustworthy climate record, not a reason to freeze every published series permanently at its first release.
A long memory is not a fixed destiny
The ocean’s response is slow on human news timescales. The IPCC technical summary assesses ocean warming as irreversible over centuries to millennia, while also stating that the magnitude of future warming depends on the emissions scenario. Both parts matter. Long-lived consequences do not mean that future choices make no difference.
This is a difficult message for a culture accustomed to an annual score. A cooler surface interval is not a reset of the accumulated energy store. A new record is not evidence that every conceivable future is now identical. The task is to distinguish what is already committed from what further emissions would add.
The same distinction separates adaptation from resignation. Planning for changes already unfolding can coexist with reducing the drivers of additional change. Treating these as rival responses misunderstands the different timescales. An observing network helps by keeping the physical account current, rather than allowing each argument to select the single graph most convenient to it.
For readers, the useful habit is to ask one more question after a temperature headline: measured where, over which depth and compared with what? The answer can reveal why two apparently conflicting results are both correct, or why an apparently dramatic comparison is not comparable at all.
The ocean does not keep its heat in a single layer, and it does not release its history at the end of a calendar year. Following the measurements below the surface makes the climate story less like a contest between annual records and more like the continuing energy account it actually is.
Sources & context
This article draws on the sources linked in the text. Analysis and illustrative scenarios are identified separately from reported findings.
- January 2026 study of the preceding year's ocean conditions
- World Meteorological Organization's 2025 climate summary, released in 2026
- account of its role in climate monitoring
- Argo program's float description
- Ocean Heat Content Climate Data Record
- mission description
- IPCC's physical-science assessment
- Copernicus ocean-heat-content indicator
- IPCC technical summary